Release Notes - 2023.1
Welcome!
In this section, you will find the Release Notes for version 2023.1 of GPM Plus. If you have questions or feedback, please contact your GPM representative.
Release Highlights
New
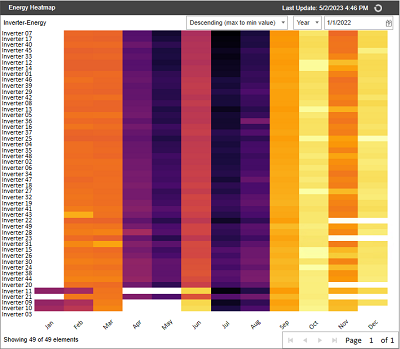
New Heatmap Feature
The new Heatmap module in the Plant dashboard displays historical aggregated data at the element level. This allows you to identify where and when assets in your portfolio are under-performing. This helps to evaluate and address inefficiencies at the level of individual elements (for example, inverters or wind turbines).
For more information, see the Heatmap section of the GPM Plus User Guide.
Improved
Network Operating Center Notifies of Loss of Communications Events
We adapted the user interface (UI) of the Network Operating Center (NOC) to standardize its behavior with the SCADA Layout plugin and provide real information.
-
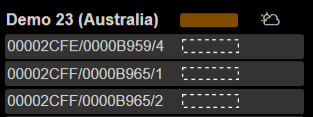
When a "Loss of communications" event occurs, the element becomes highlighted and an icon appears to represent a triggered alarm. The progress bar appears empty and is outlined in dotted lines.
Figure 2. Element with Loss of Communications Event 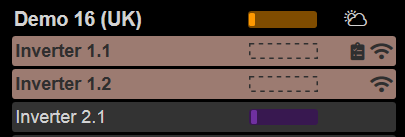
-
When the "Last value read" is older than the time specified in the custom configuration of the plugin, the progress bar appears empty and outlined in dotted lines.
Figure 3. Element with Last Value Older than Specified Time Period