Release Notes - 2023.3
Welcome!
In this section, you will find the Release Notes for version 2023.2 of GPM Plus. If you have questions or feedback, please contact your GPM representative.
Release Highlights
New
GPM SCADA Supports Large-scale SCADA Projects
We built a faster infrastructure for data recording and recovery to handle greater numbers of variables. This means that all SCADA projects benefit from faster data availability after restarting GPM SCADA. This is especially beneficial for users who work with complex and sate-of-the-art projects that monitor a large amount of data and signals, allowing them to resume work faster and more efficiently.
We made considerable improvements to the configuration processes of GPM SCADA and related monitoring services. This allows GPM to configure and deliver projects faster and more efficiently. In particular, this enables configuring and editing large amounts of variables and elements in plant hierarchies with a great level of complexity, while still guaranteeing the high-quality performance of the system. This means that you can expect to continue to work uninterruptedly while our team performs the necessary updates to meet your needs at all times.
The SCADA Layout ModuleSCADA Layout Module has improved performance, and now allows monitoring one-second data for a large amount of devices (up to 60 000). This feature is crucial for users who need to monitor different types of devices in real-time.
GPM SCADA can now communicate with RTUs through an OPC-UA Communication Protocol. This enables you to monitor RTUs more efficiently, with no risk of saturating the network. Furthermore, future developments will expand the benefits derived from using an OPC-UA communication protocol (for example, improved quality in data monitoring and calculations).
Previously, the only standard communication protocol to monitor RTUs was Modbus. This protocol will continue to be available for projects that require it.
New Plugin to Run Python Algorithms in GPM SCADA
GPM SCADA projects now have an integrated plugin to perform algorithmic calculations independently of the GPM Analysis Server. This allows the system to perform essential computations locally, without needing internet access or connections to other software.
Previously, SCADA environments experienced excessive waiting times before being able to consume and process data. This is due to the fact that most SCADA environments are isolated and have limited internet access, which causes delays in receiving data from the GPM Analysis Server.
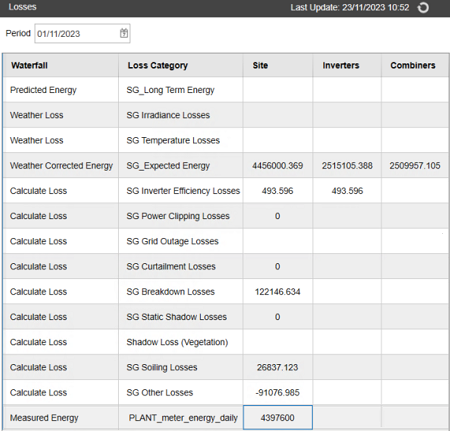
New Losses Categorization Table
The Losses Categorization Table in the Plant Dashboard allows you to identify, categorize and quantify the energy losses of your plants, compared to the predicted production. This provides insight and a detailed understanding of the reasons behind the losses, enabling you to make strategic decisions to improve your energy production.
For more information, see the Losses Categorization Table section of the GPM Plus User Guide.
For more information, see the Losses Categorization Table section of the GPM Plus User Guide.
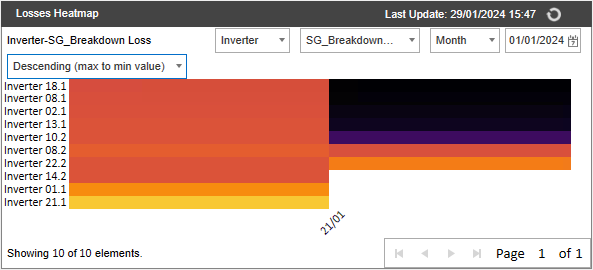
New Losses Heatmap
The Losses Heatmap in the Plant Dashboard provides an advanced interactive color-coded visualization of energy losses over time across various devices. This allows you to identify patterns, trends and anomalies in energy production.
For more information, see the Losses Heatmap section of the GPM Plus User Guide.
For more information, see the Losses Heatmap Table section of the GPM Plus User Guide.
New Web API Endpoints
We are excited to announce that we have just released version 2.81280.1 of GPM Web API. This version introduces two new endpoints with which you can retrieve data related to alerts.
Alert details enpoint: returns all details from a specific alert by its ID.
Alert status enpoint: returns all alerts belonging to a specific plant. You can filter by the start date, end date, and status of the alerts.
Improved
Deploy Advanced Analytics from the User Interface
You can now deploy Advanced Analytics for one or more plants directly through the Plant Management screen of the GPM Plus user interface. This allows you to quickly configure the analytics for clients, reducing time and dependencies with other teams. It also reduces the margin for human error. Previously, it was only possible to deploy Advanced Analytics through the GPM Plus API, which made the process complex and more time-consuming.
Fixed
Alarms
We fixed two issues that affected the functionality of alarms.
When alarms are activated, email notifications are sent correctly. Previously, an error could prevent the notification from reaching the intended recipients.
You can now add new actions or edit existing actions in the Email functionality without having to fill all the fields in the configuration. Previously, an error prevented changes from being saved if any of the fields remained empty.
Reports Generated in Bulk Display Correct Values
The Reports plugin generates reports with correct values. Previously, an error could cause the generated reports to display incorrect values when you generated the same report for different dates in a single action.
SCADA Layout Plugin Correctly Displays Inverter Statuses
The SCADA Layout plugin displays the correct color code for the status of inverters and other devices. Previously, an error could cause certain elements to display in color that did not correspond with their statuses.
Charts in Dashboard Plugin Display Correct Values
The charts in the Dashboard Plugin now display correct values for irradiance and production. Previuosly, an error could cause the charts of plants with predetermined limits to display incorrect values above the established thresholds.
WebAPI Returns Correct Information for Alarms
The WebAPI returns correct information for queries for alarms ("get/api/Alarms"). Previously, an issue could cause this query to return an error message.
Plant Configuration Correctly Saves Changes
The Plant Configuration feature correctly saves changes to plants. Previously, an error could prevent changes from being saved and applied in certain environments.