Losses Heatmap
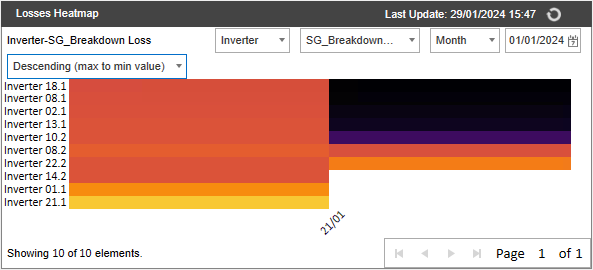
The Losses Heatmap is an advanced visualization feature that presents a detailed and interactive view of energy losses across devices over time. This feature leverages GPM's Advanced Analytics to allow you to identify patterns, trends and anomalies in energy production and output.
Losses are color-coded to reflect the severity of each loss category, based on its impact on production. The color code can be customized to meet the specific requirements of your organization.
|
The Losses Heatmap has five main functionalities:
-
Temporal loss analysis enables you to visualize how different types of losses vary over time, providing insights into periodic or sporadic issues.
-
Device-specific insights allow you to break down losses by device, to quickly identify underperforming or faulty components in a plant.
-
Pattern recognition facilitates the identification of recurring issues, such as regular drops in production related to seasonal changes or maintenance schedules.
-
Comparative analysis of different time periods or devices makes it easy to pinpoint effective operational strategies and maintenance interventions.
-
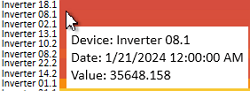
Interactive exploration allows you to interact with the data, zooming into specific time frames or focusing on particular devices or loss types.
Loss Categories
Loss categories are detailed and quantifiable definitions of the factors that affect your assets and cause losses in production and output. This enables a level of great detail to classify and analyze the difference between the expected or estimated energy production and the actual production at the level of plants and individual devices (for example, inverters or turbines).
| Category | Description |
| Actual energy | Real energy output of the plant after accounting for all losses. |
| Clipping | Losses caused by limiting the energy production of inverters to their maximum capacity. |
| Curtailment | Deliberate reduced output due to grid management or response to overproduction. |
| Expected energy/Theoretical production | Projected energy yield after taking into consideration corrections for irradiance and temperature. |
| Grid outage | Energy lost or not produced due to failures in the connectivity of the power grid. |
| Inverter efficiency | Discrepancy between the expected and the actual performance of inverters. |
| Inverter outage | Downtime or inefficiency of inverters, affecting energy conversion. |
| Irradiance correction | Adjustment of predicted production, based on real-time solar irradiance. |
| Partial breakdown | Malfunction or degradation in a section of the solar array. |
| Predicted production | Initial forecast of energy output, based on historical data and plant capacity. |
| Temperature correction | Modification to account for temperature impacts on the efficiency of panels. |
| Shadow | Losses caused by shading of the panels, due to natural or artificial obstructions. |
| Soiling | Losses caused by dirt, dust and other residues on solar panels. |
| Tracker misalignment | Reduced efficiency due to the solar trackers sub-optimally aligning the panels with the sun. |
| Tracker stow | Losses caused when trackers are stowed for protection (for example, during harsh weather conditions). |
| Vegetation | Reduced efficiency caused by overgrown vegetation that casts shadows or damages panels. |
| Other losses | Miscellaneous or unidentified causes. |